5.7. TensorBoard Usage 

 #
#
Note
Supported backends: TensorFlow , PyTorch , Paddle
TensorBoard provides the visualization and tooling needed for machine learning experimentation. Full instructions for TensorBoard can be found here.
5.7.1. Highlighted features#
DeePMD-kit can now use most of the interesting features enabled by TensorBoard!
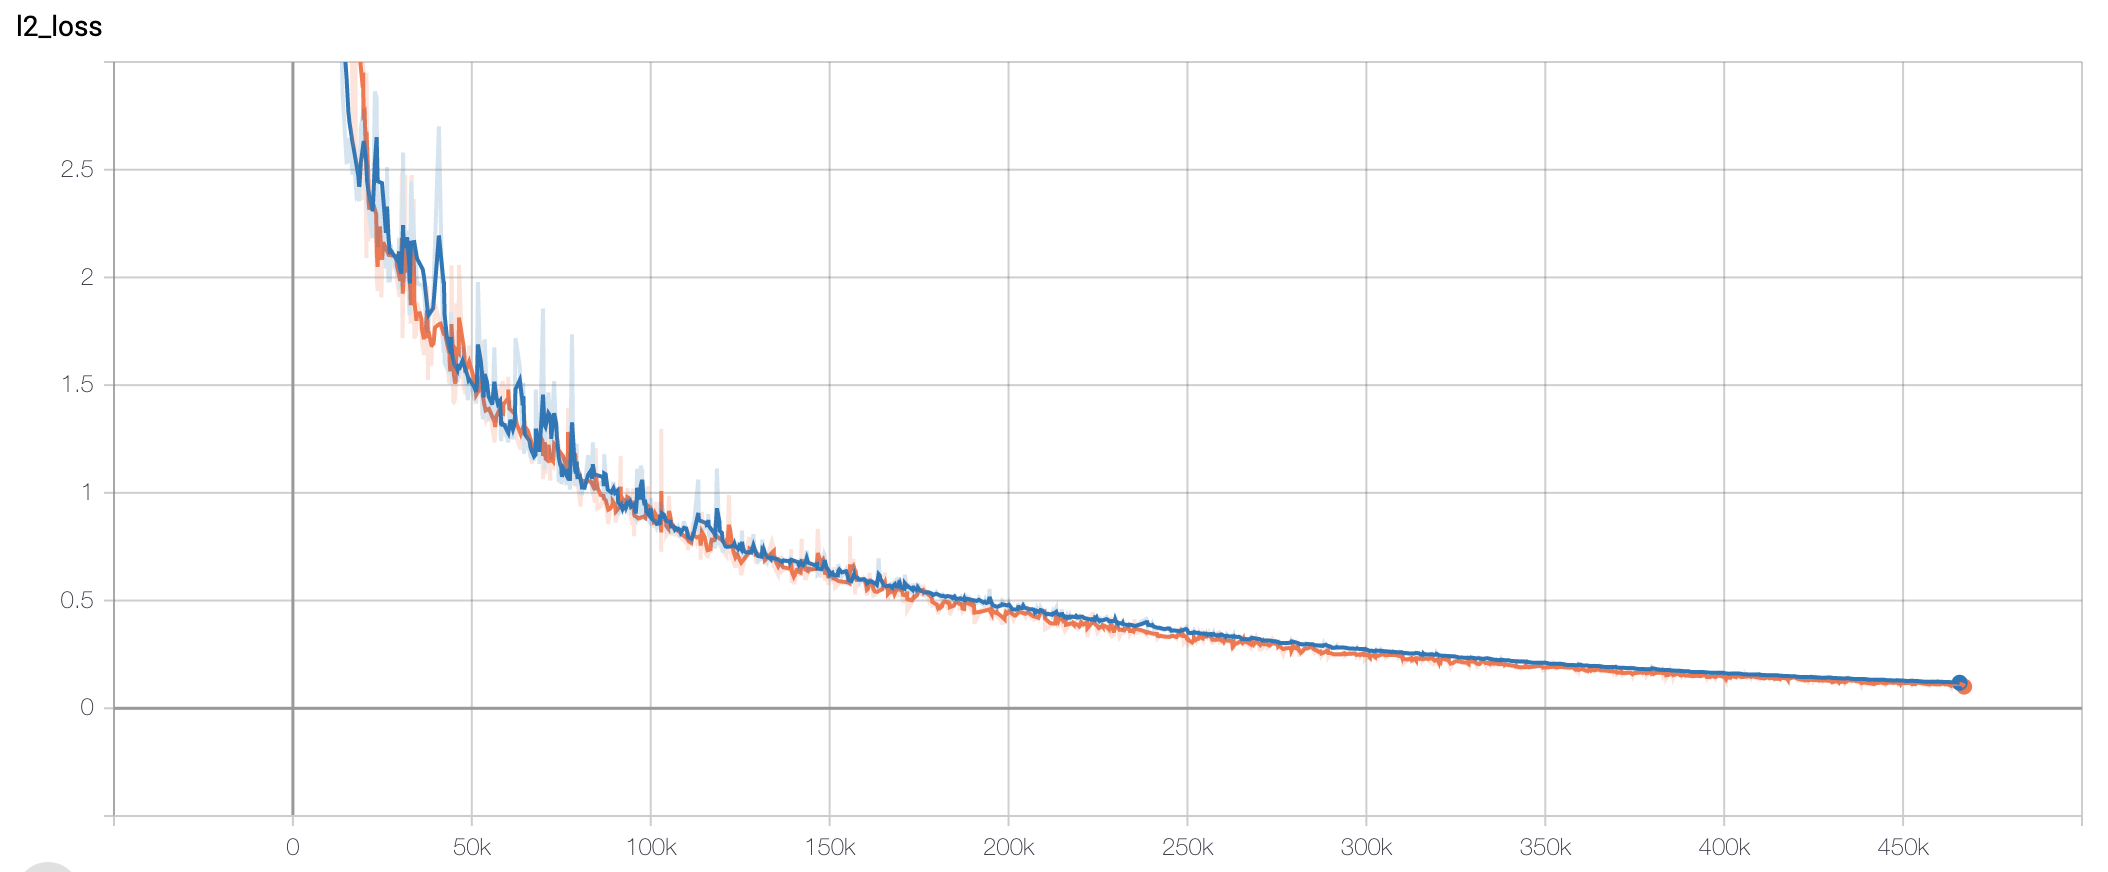
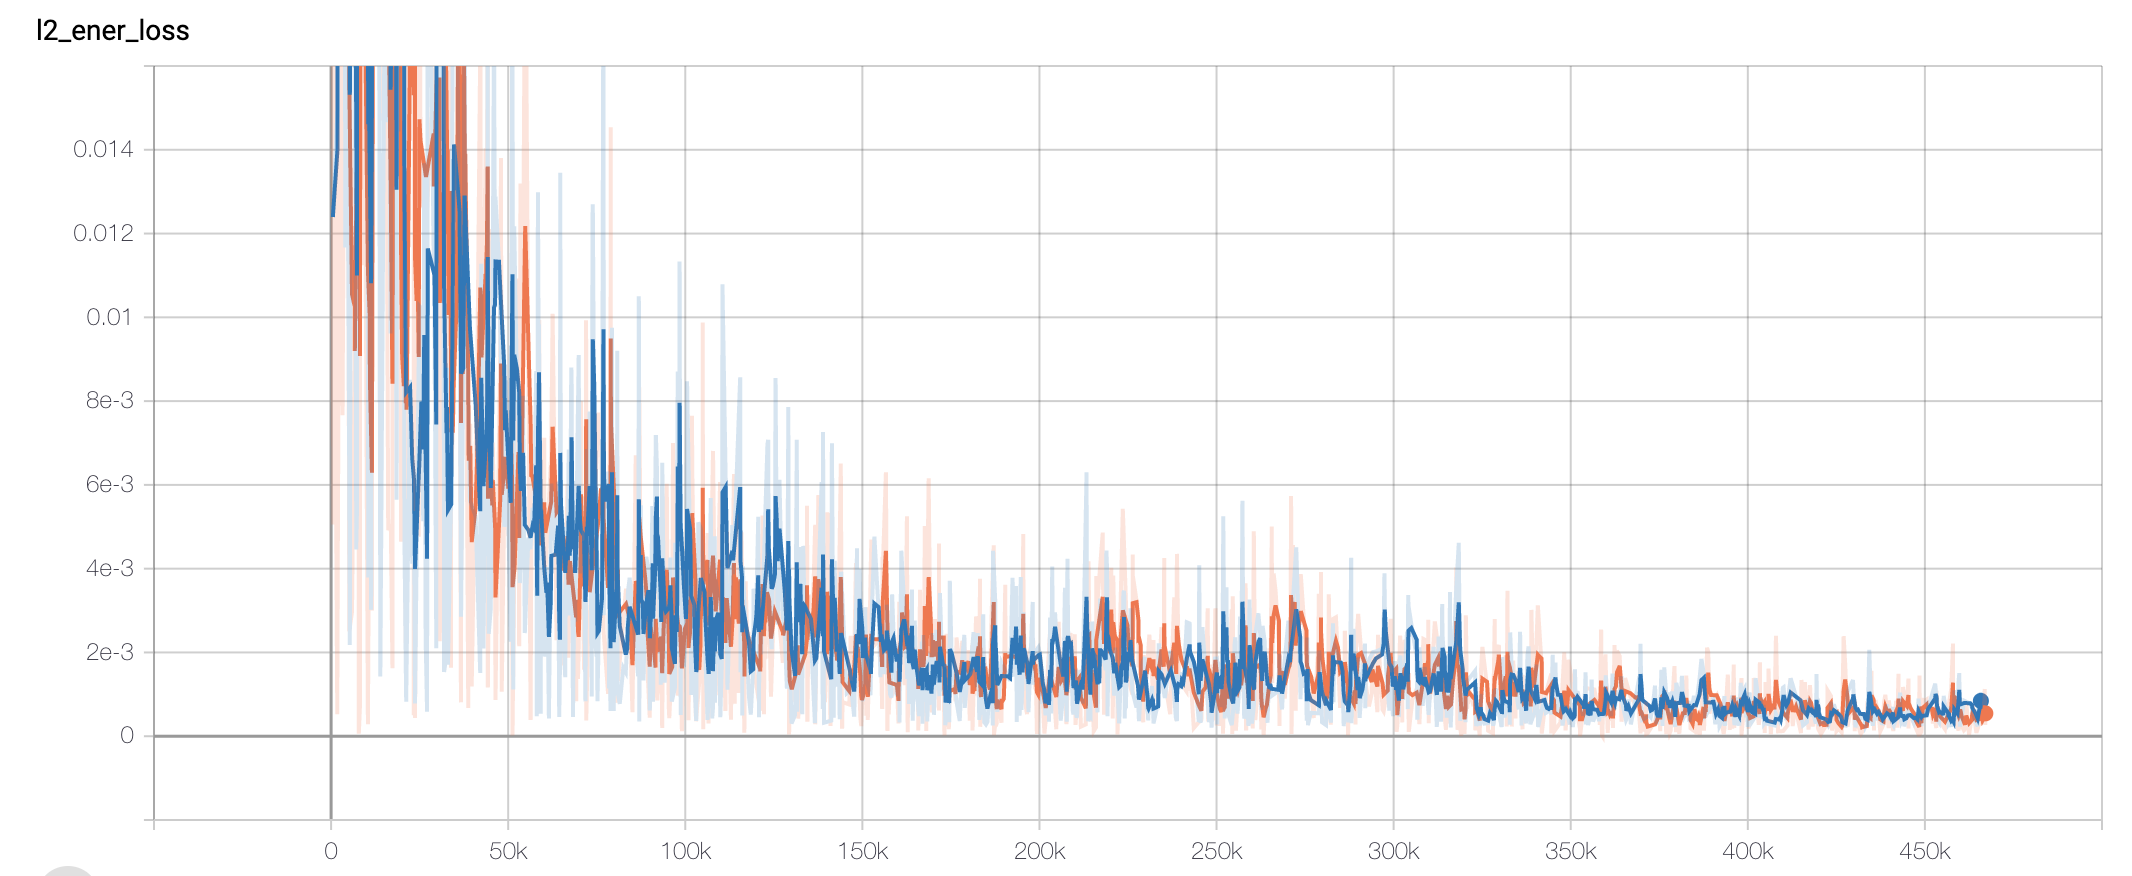
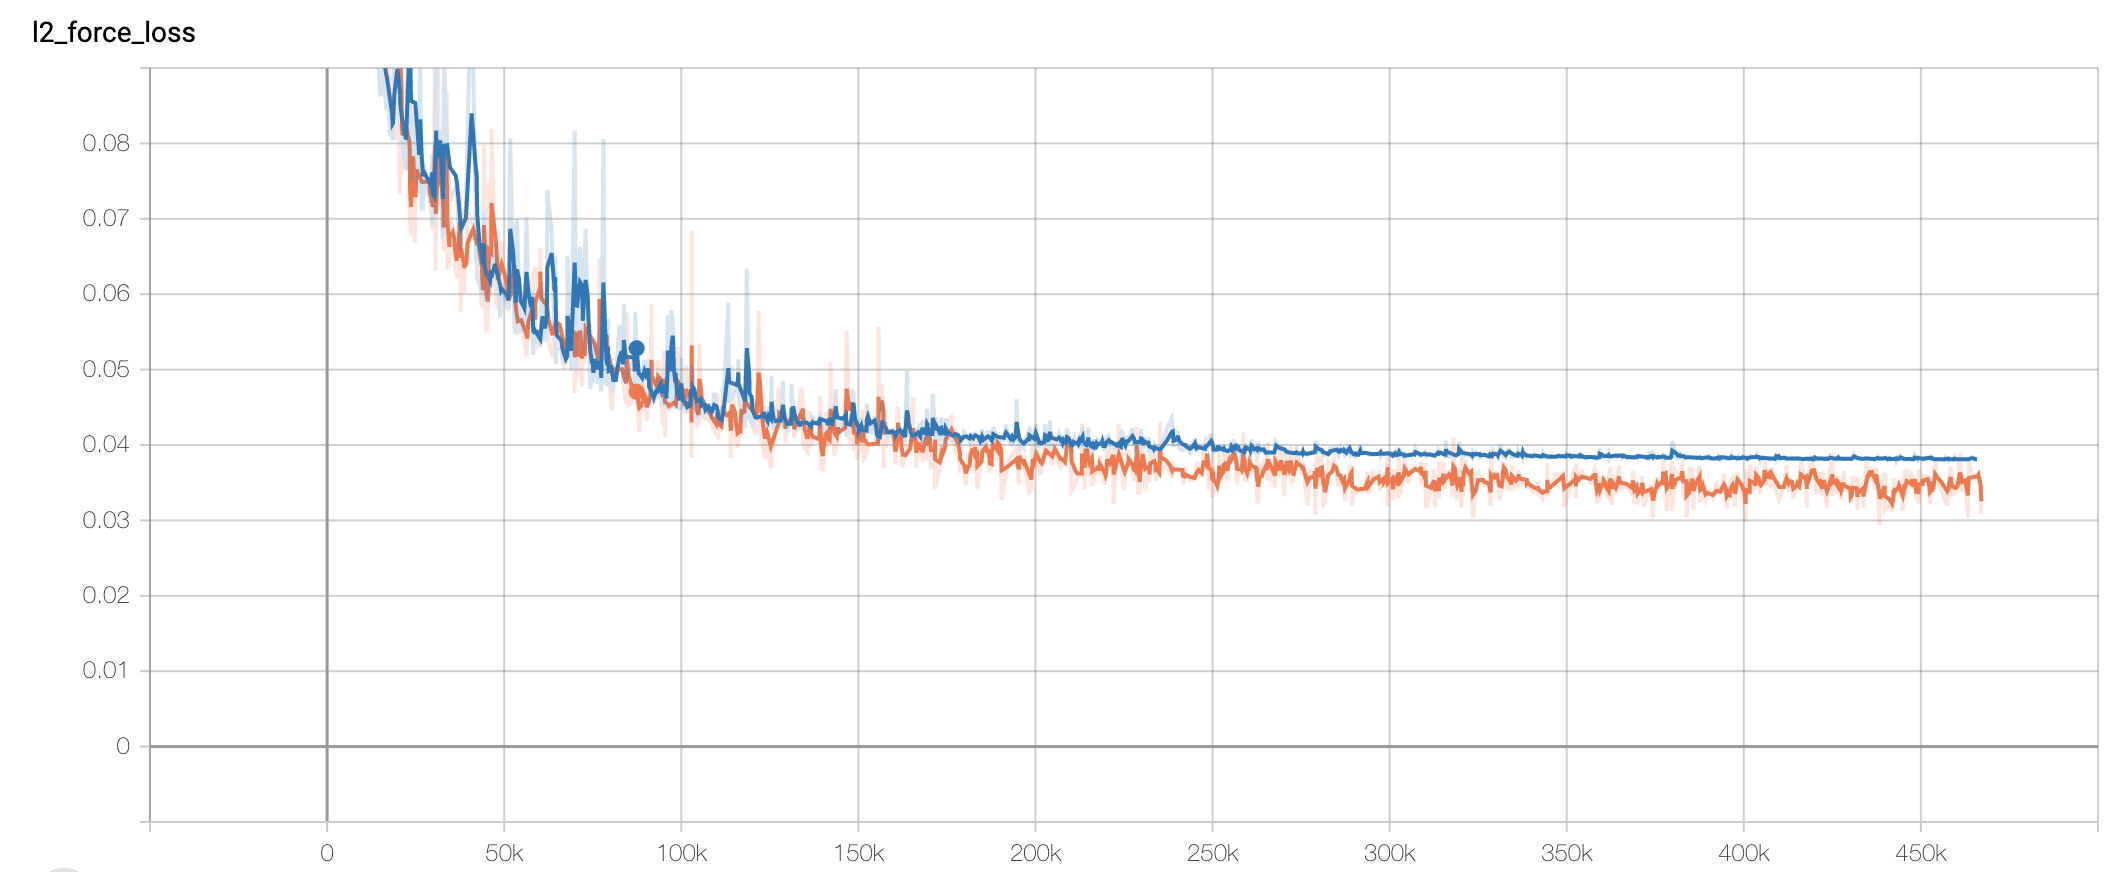
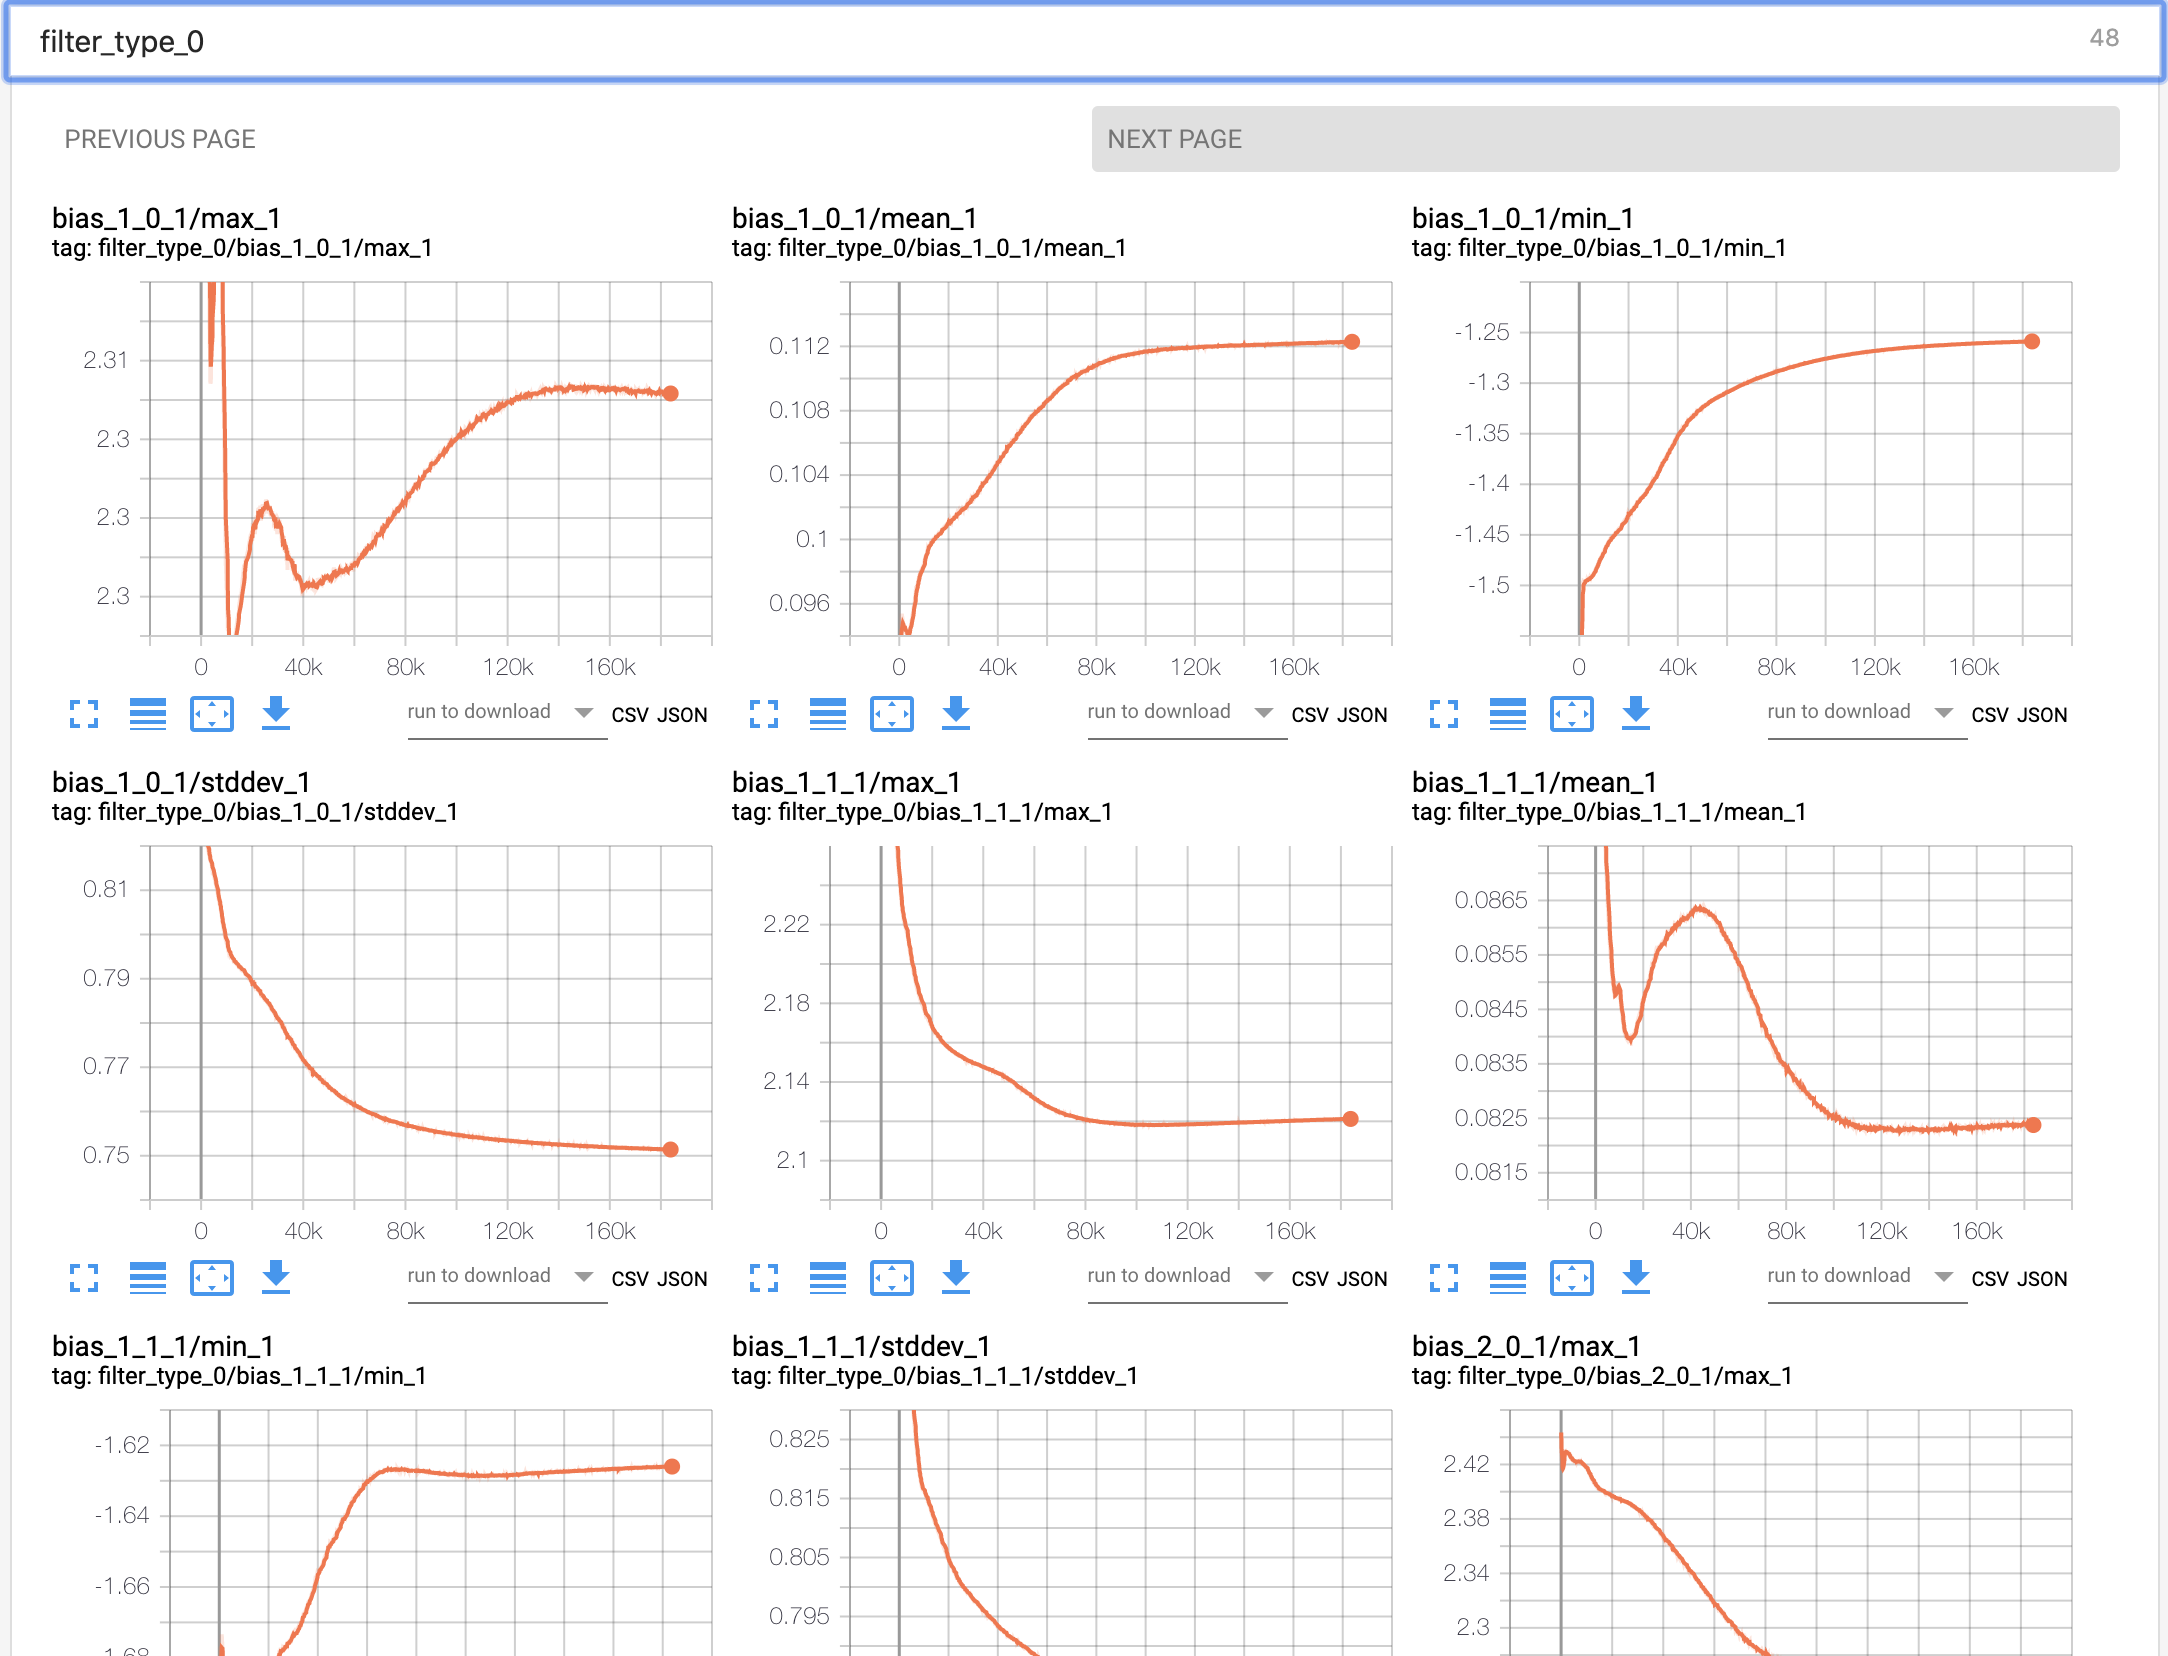
Tracking and visualizing metrics, such as l2_loss, l2_energy_loss and l2_force_loss
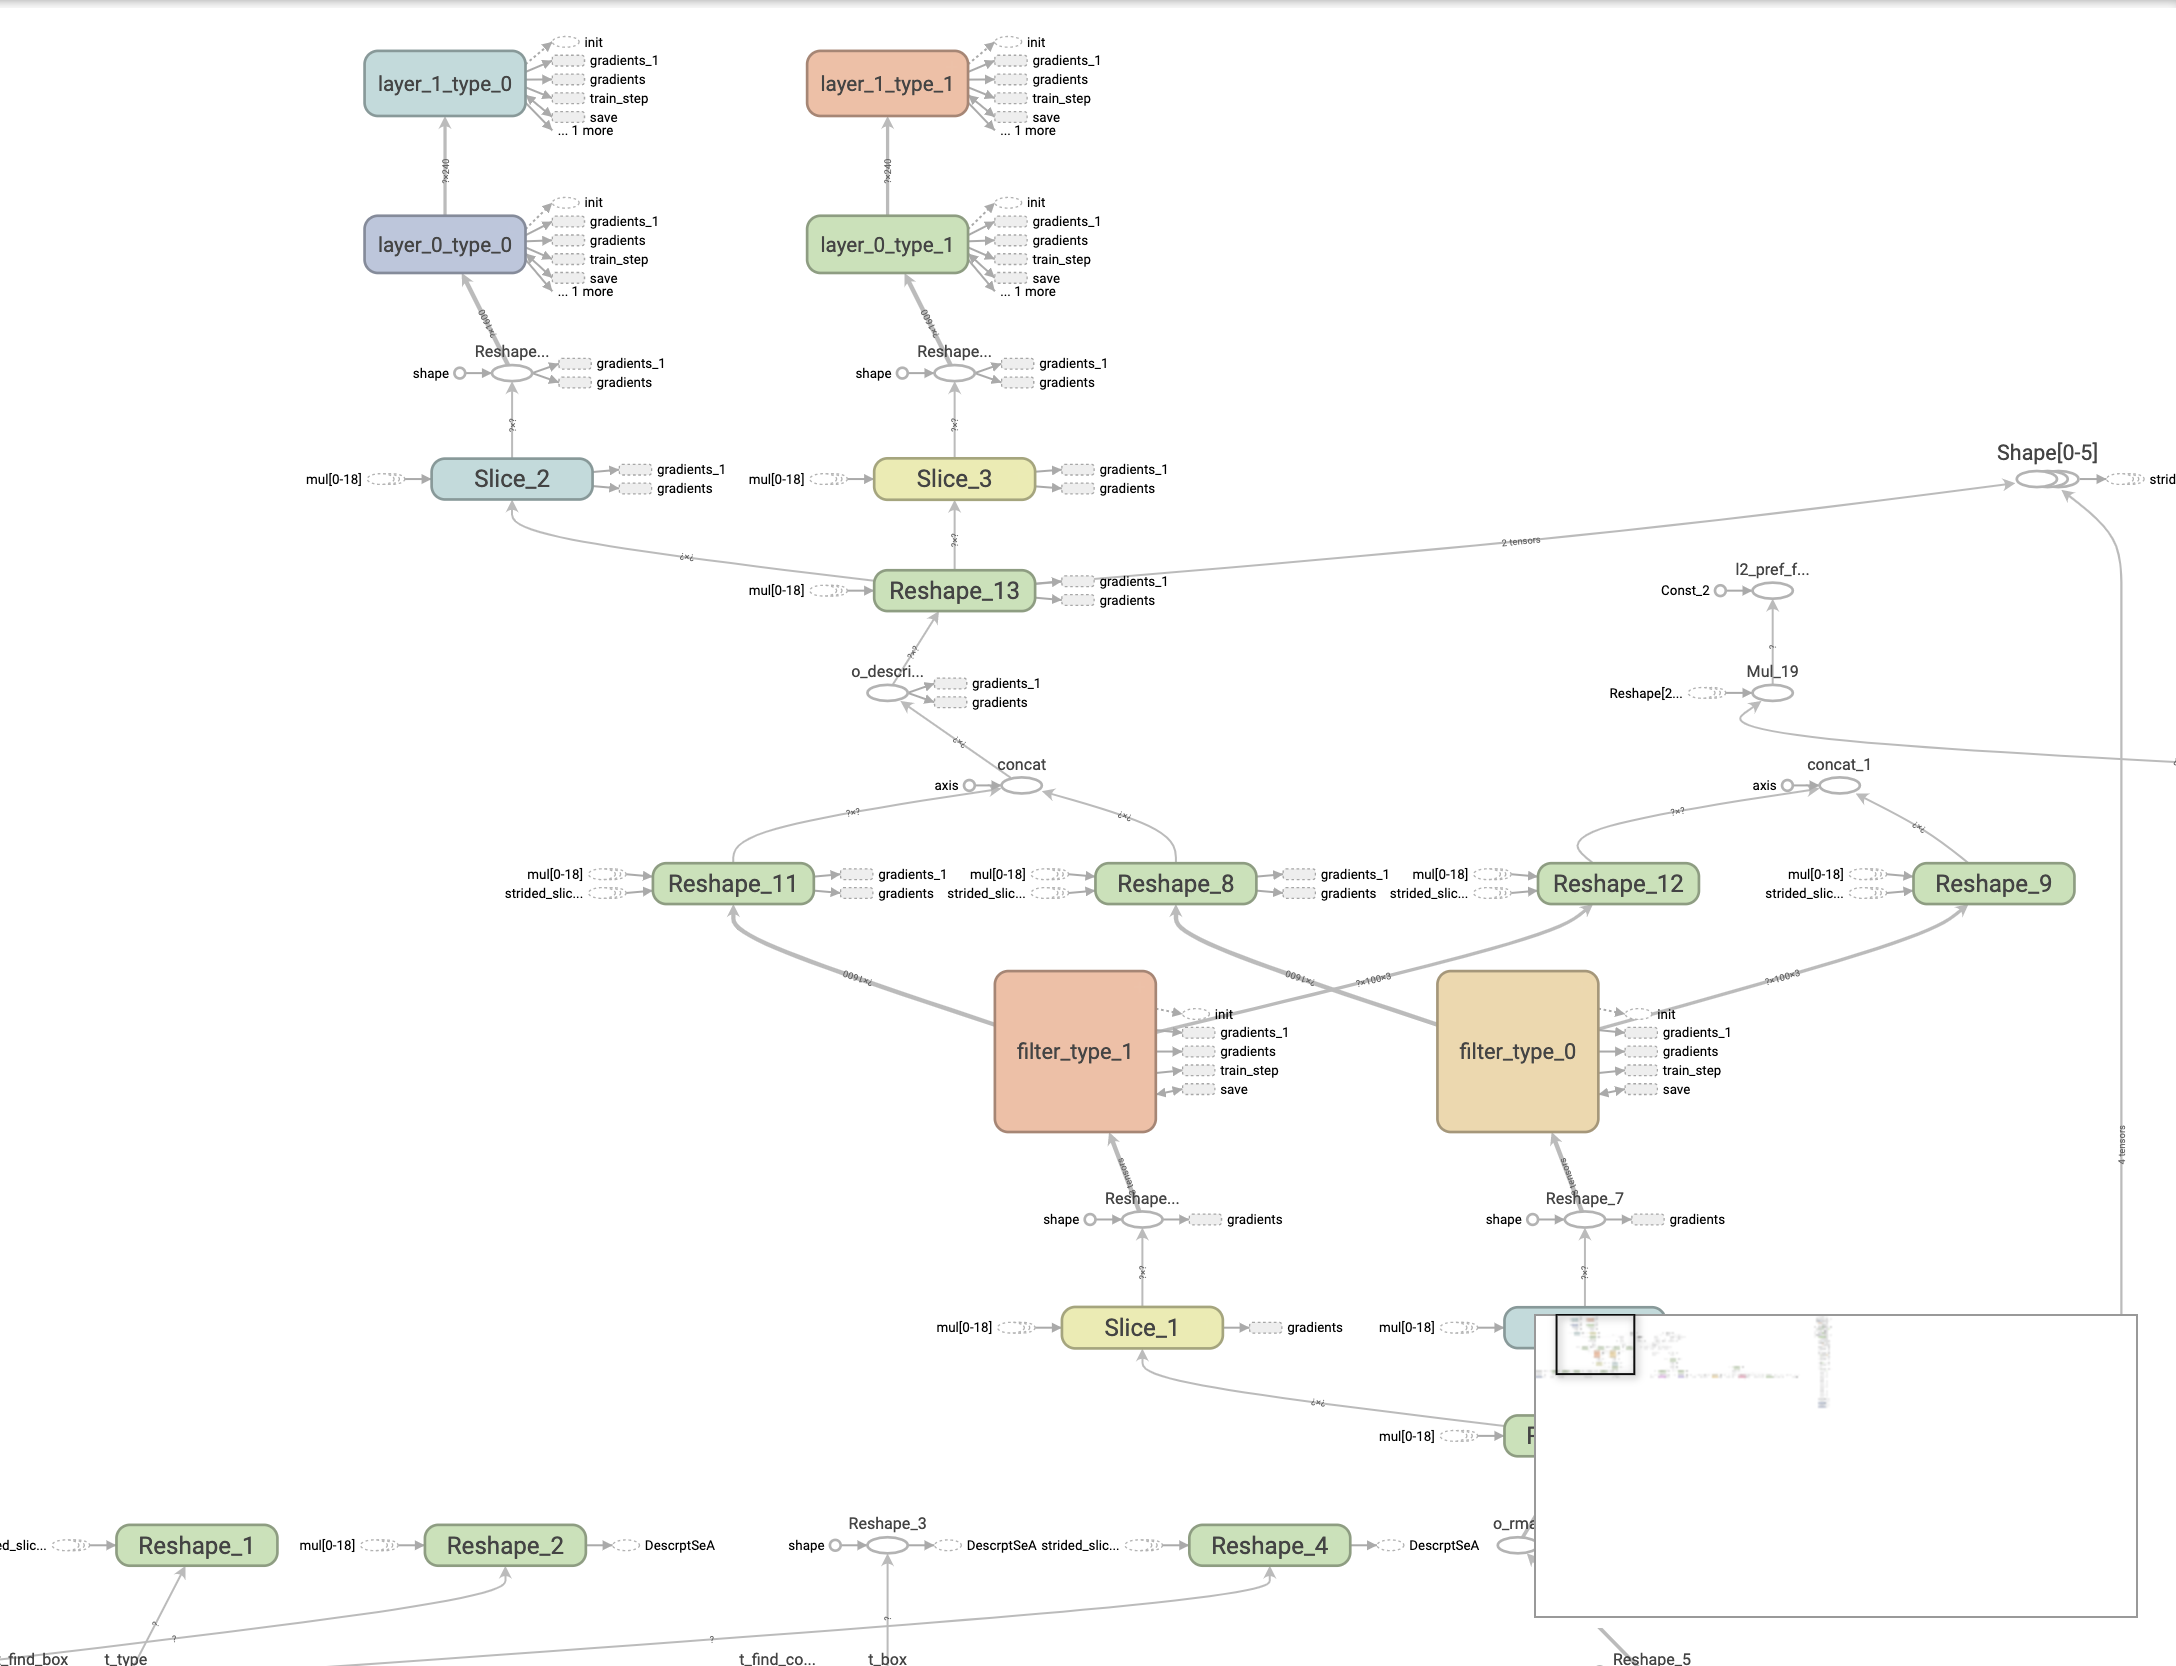
Visualizing the model graph (ops and layers)
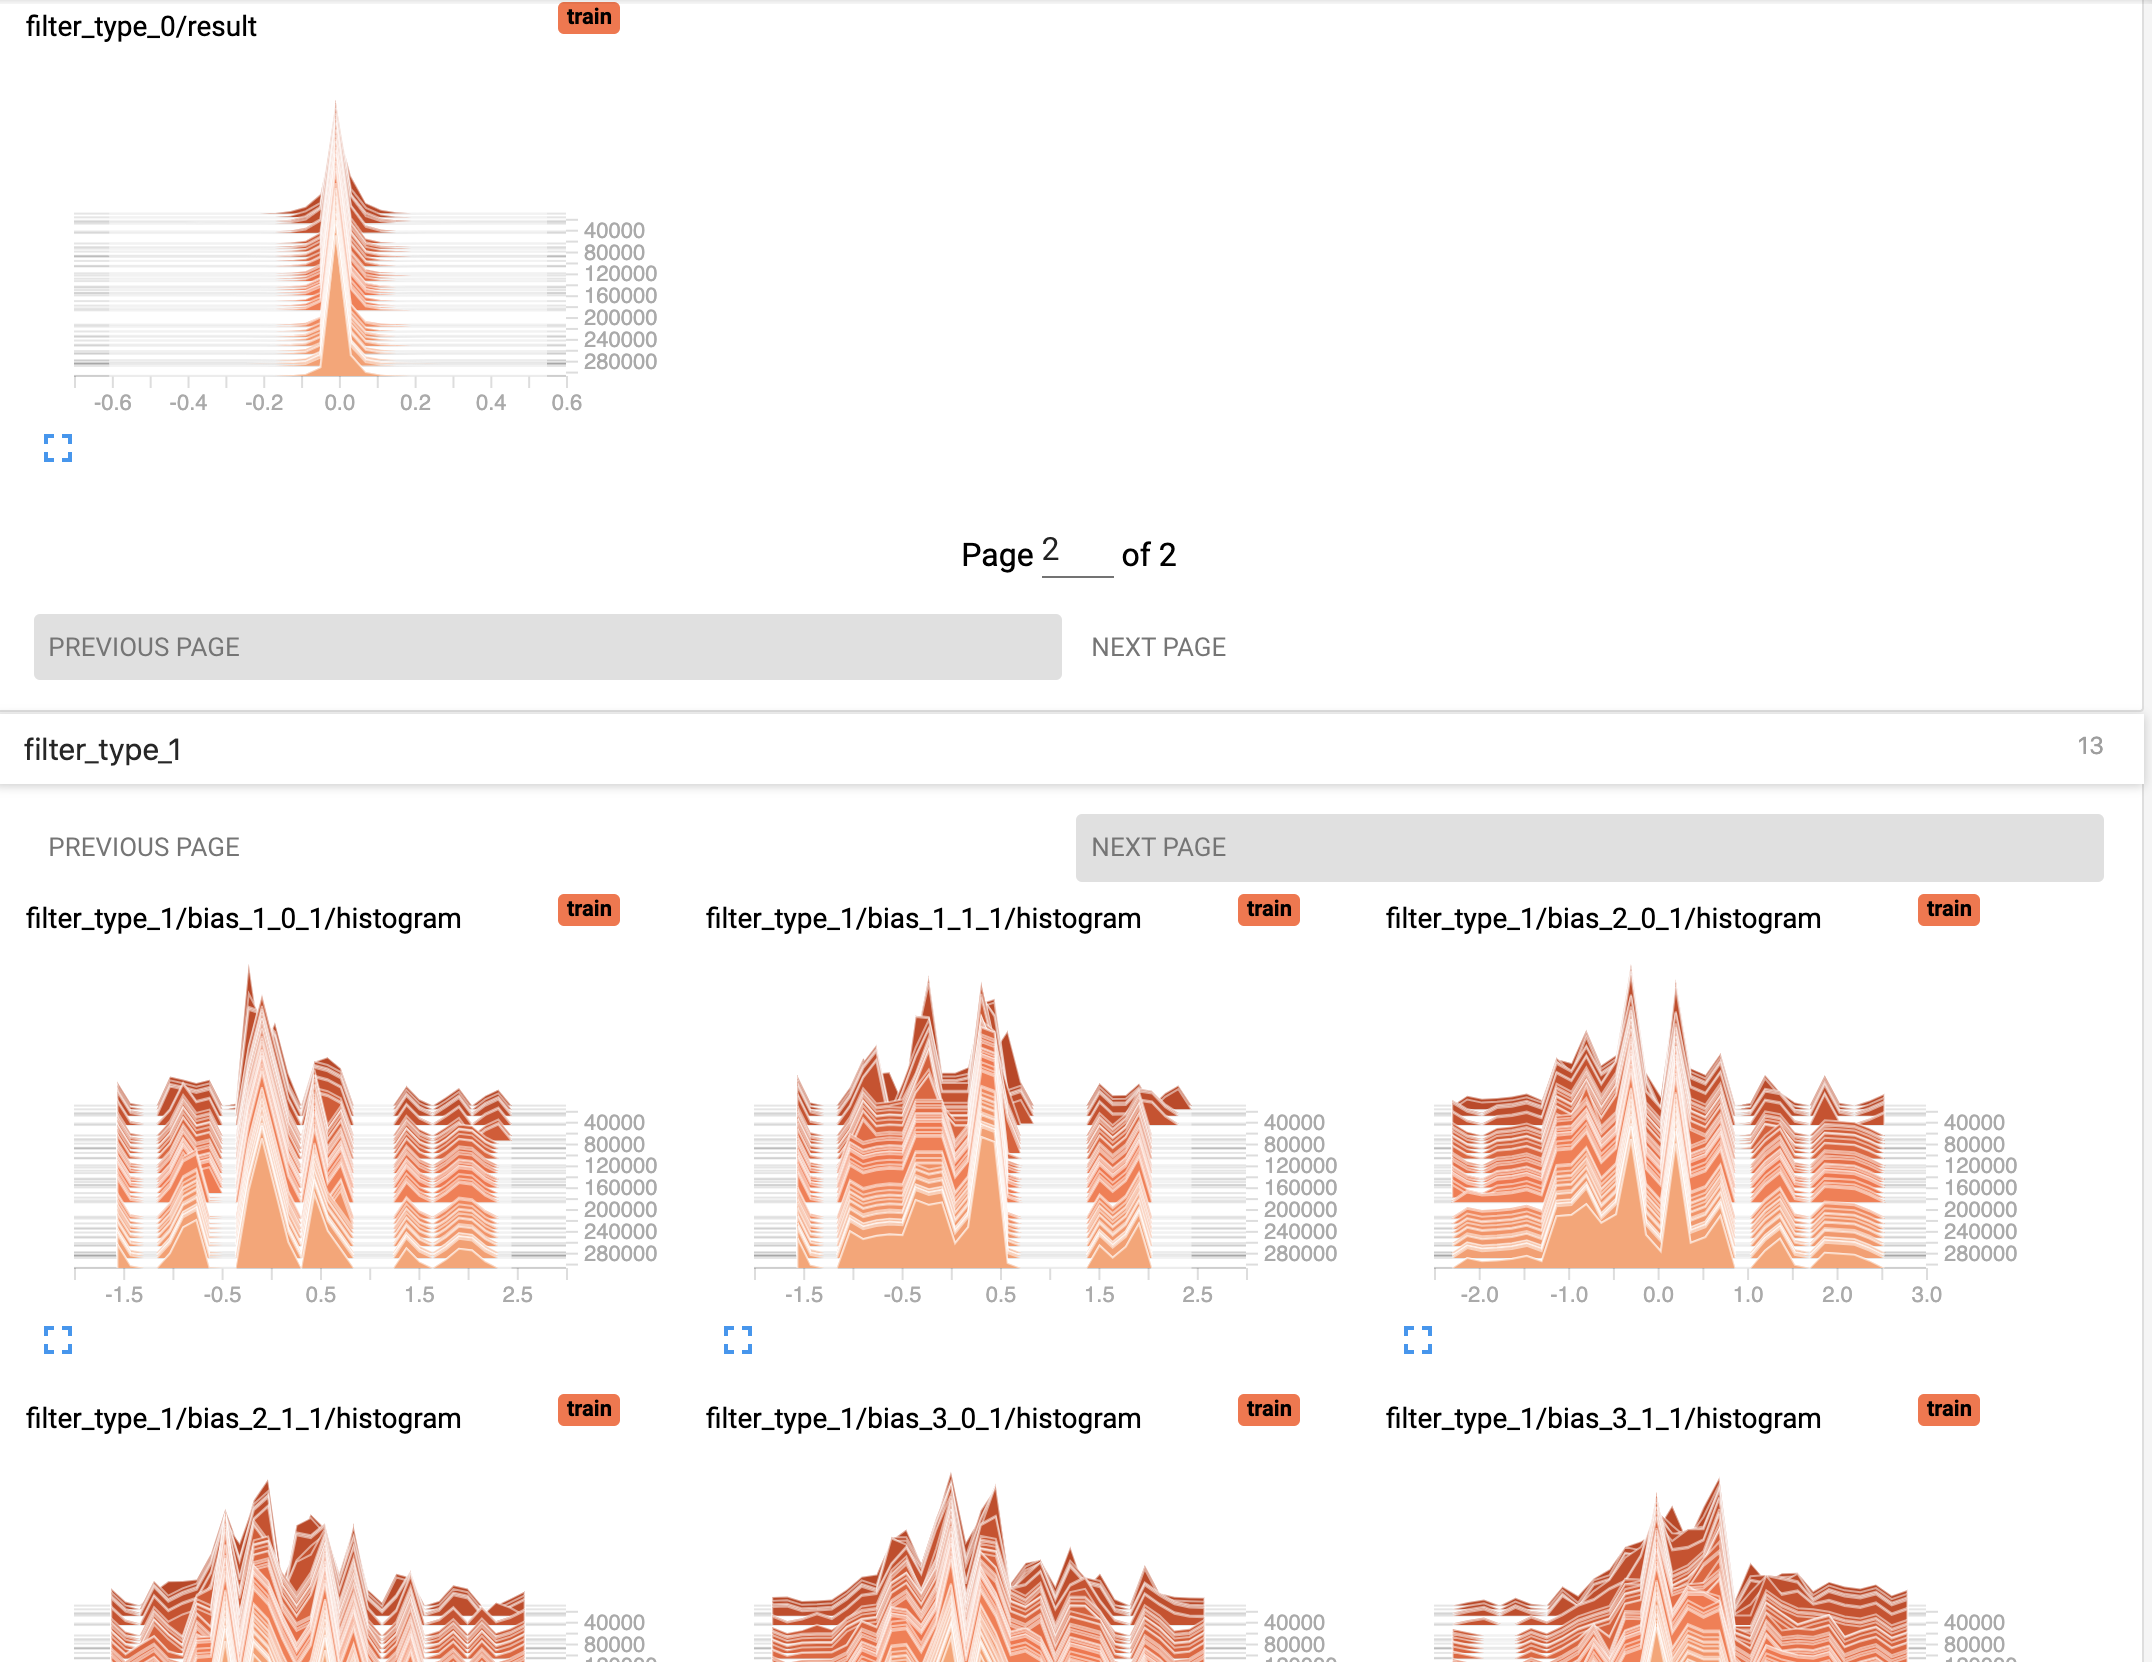
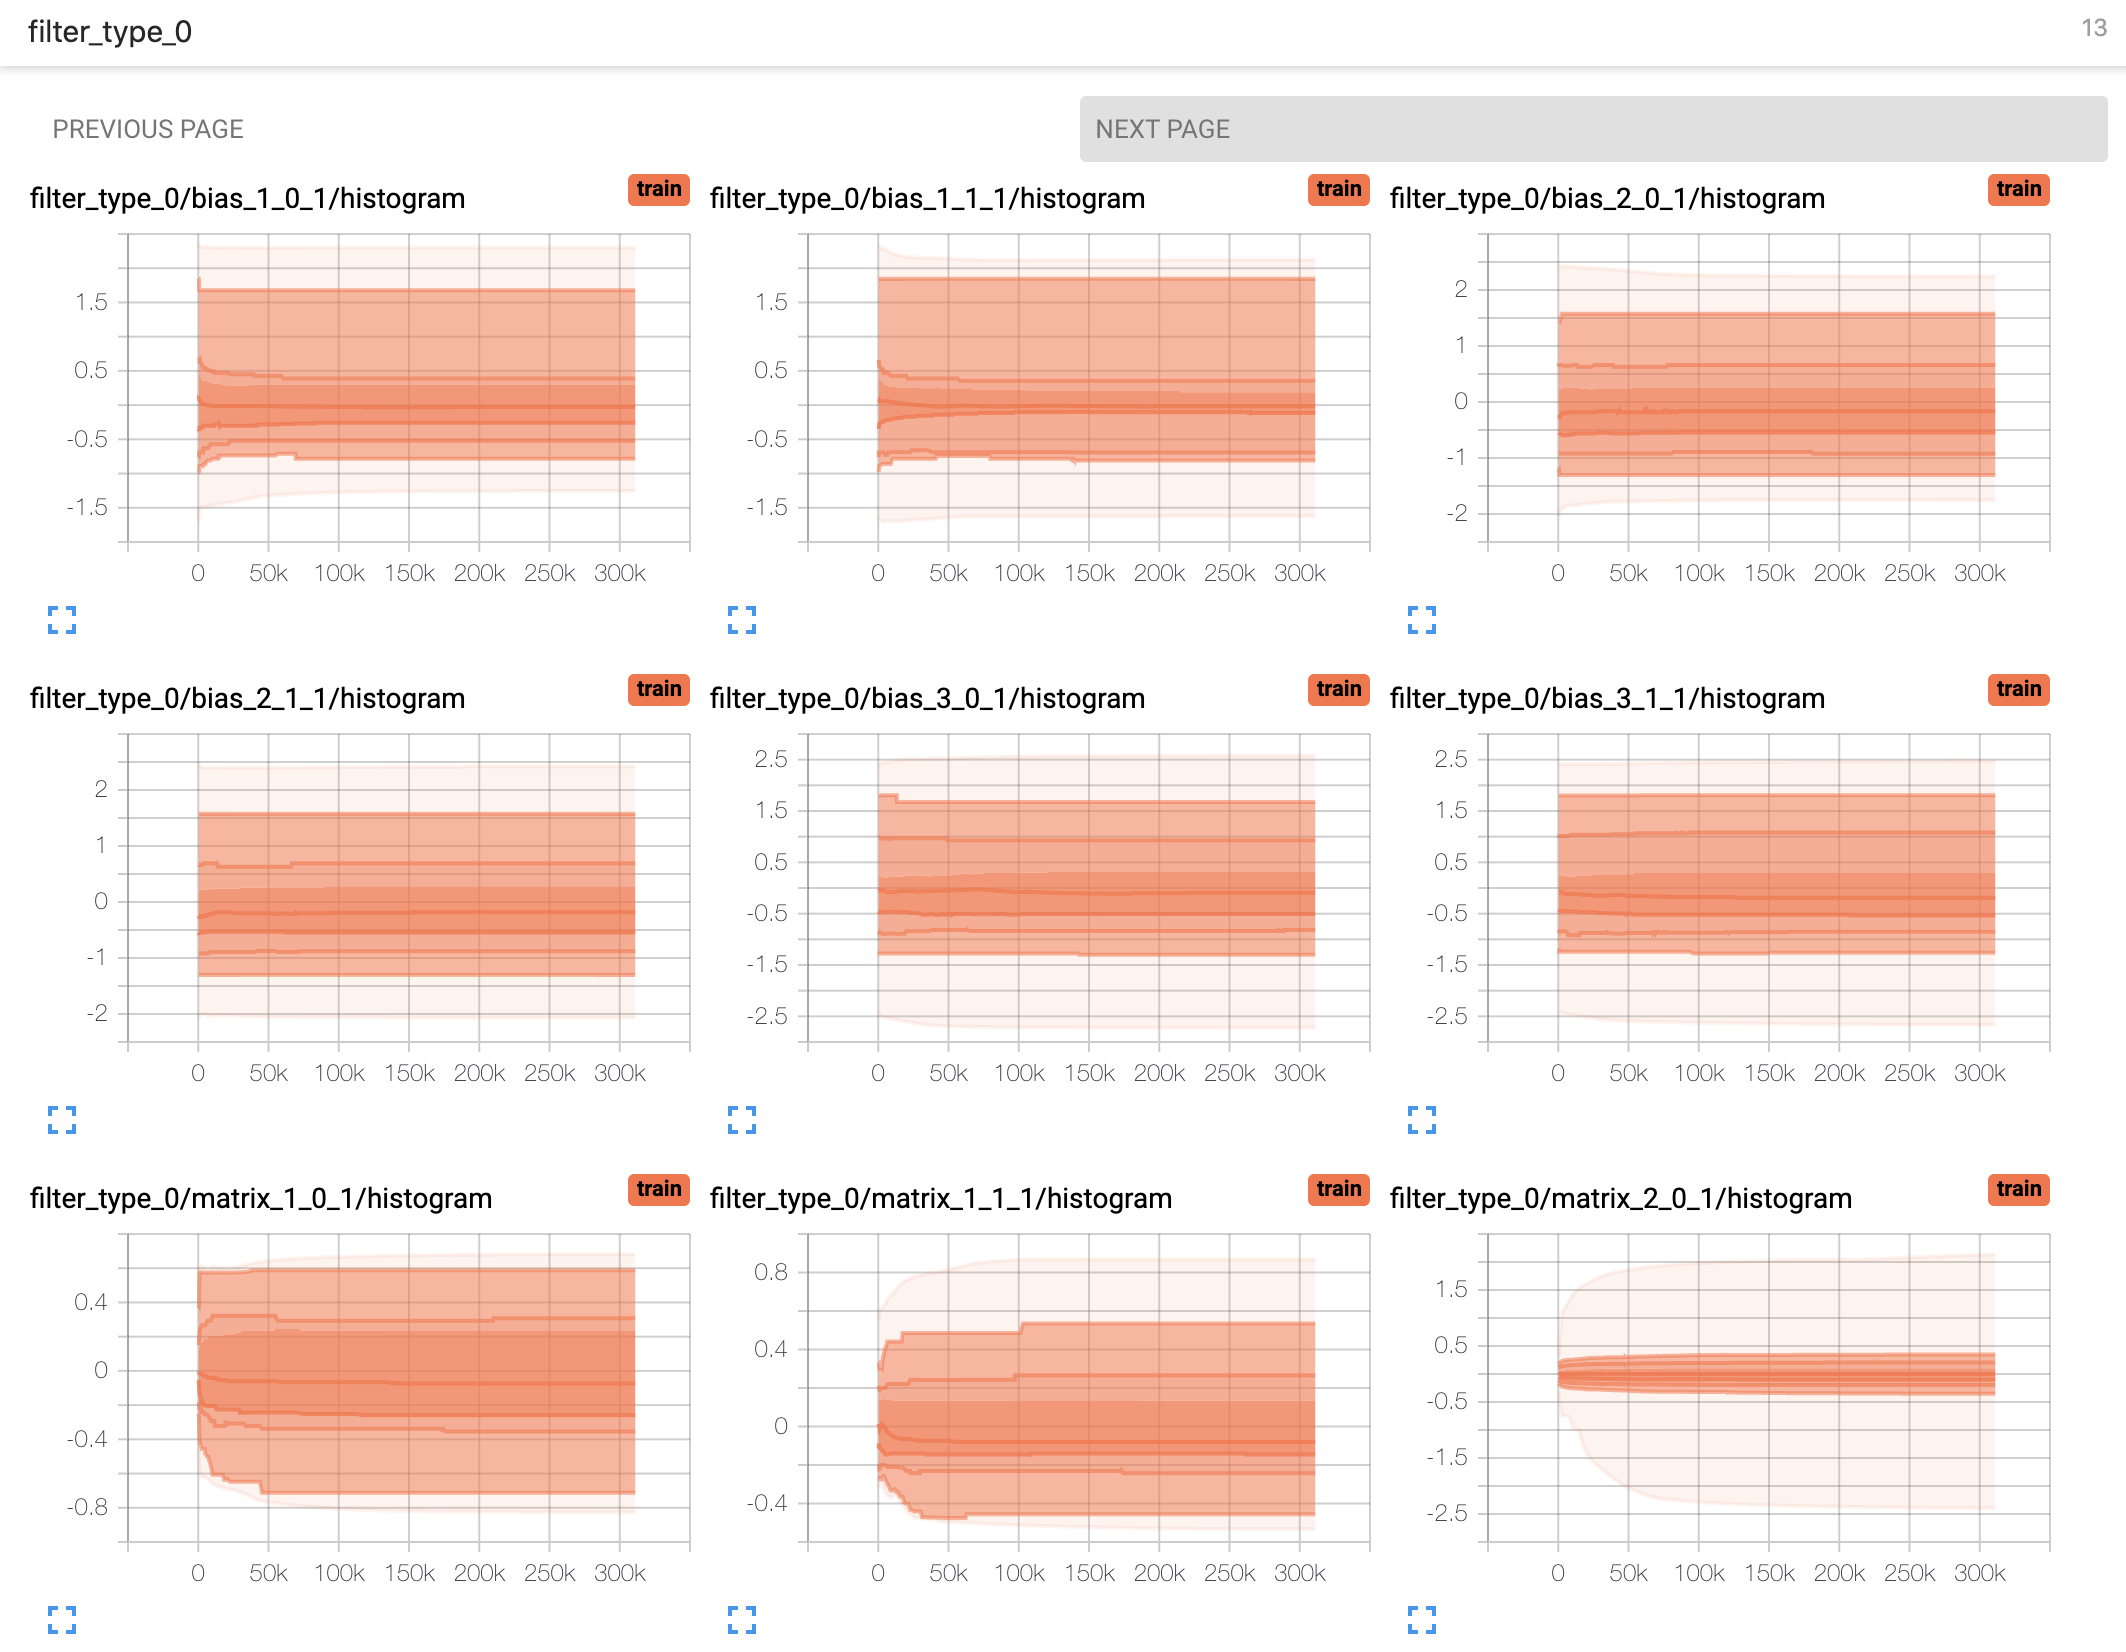
Viewing histograms of weights, biases, or other tensors as they change over time.
Viewing summaries of trainable variables
5.7.2. How to use Tensorboard with DeePMD-kit#
Before running TensorBoard, make sure you have generated summary data in a log directory by modifying the input script, setting tensorboard to true in the training subsection will enable the TensorBoard data analysis. eg. water_se_a.json.
"training": {
   "systems": ["../data/"],
   "stop_batch": 1000000,
   "batch_size": 1,

   "seed": 1,
   "_comment": " display and restart",
   "_comment": " frequencies counted in batch",
   "disp_file": "lcurve.out",
   "disp_freq": 100,
   "numb_test": 10,
   "save_freq": 1000,
   "save_ckpt": "model.ckpt",

   "disp_training": true,
   "time_training": true,
   "tensorboard": true,
   "tensorboard_log_dir": "log",
   "tensorboard_freq": 1000,
   "profiling": false,
   "profiling_file": "timeline.json",
   "_comment": "that's all"
}
Once you have event files, run TensorBoard and provide the log directory. This should print that TensorBoard has started. Next, connect to http://tensorboard_server_ip:6006.
TensorBoard requires a logdir to read logs from. For info on configuring TensorBoard, run tensorboard --help. One can easily change the log name with “tensorboard_log_dir” and the sampling frequency with “tensorboard_freq”.
tensorboard --logdir path/to/logs
5.7.3. PyTorch Profiler With TensorBoard #
DeePMD-kit has a built-in support for PyTorch Profiler. The profiler requires extra packages for recording and visualization: pip install tensorboard torch-tb-profiler Set "enable_profiler": true in the training section of the input script, and launch a training task with 10 steps, since the default setting of the profiler scheduler is wait=1, warmup=1, active=3, repeat=1. The profiler will generate recording files in tensorboard_log_dir.
To visualize the profiling data, launch TensorBoard (see above) and navigate to the “pytorch_profiler” tab.
5.7.4. Examples#
5.7.4.1. Tracking and visualizing loss metrics(red:train, blue:test)#
5.7.4.2. Visualizing DeePMD-kit model graph#
5.7.4.3. Viewing histograms of weights, biases, or other tensors as they change over time#
5.7.4.4. Viewing summaries of trainable variables#
5.7.5. Attention#
Allowing the tensorboard analysis will takes extra execution time.(eg, 15% increasing @Nvidia GTX 1080Ti double precision with default water sample)
TensorBoard can be used in Google Chrome or Firefox. Other browsers might work, but there may be bugs or performance issues.